Diagrams
Of the kind I need, a practical guide to the creation thereof
March 2, 2015 — November 9, 2023
On the art and science of line drawings. I am especially interested in scientific diagrams; drafting/CAD/engineering stuff is somewhat different emphasis, but you might still find some usable ideas here.
I am also interested in diagrams that are some mix of freehand and procedural; maybe partly generated algorithmically and partly through a GUI. Generally I would like these to export to a modern compatible vector format which means SVG, PDF or, as a fallback, one of these other formats that can be converted to the above, such as Adobe Illustrator, EPS or xfig. I am no graphic designer, but I understand that it is a habit of successful scientists to have an effective Figure 1. But possibly I can make adequate diagrams rather than terrible ones, while waiting on a graphic design budget.
Seeking inspiration or examples of what I am talking about. Gallery of concept visualisation: gallery of methods for explaining complex ideas; everything from exotic 3d stuff to crayon drawing and sticks. Construct your mood board!
See also interactive visualisations.
Here’s the stack exchange list of tools. What follows is my list, in descending order of (fluctuating) frequency of use.1
My current recommendation: Start with diagrams.net and tidy up any mathematics etc in inkscape.
1 diagrams.net
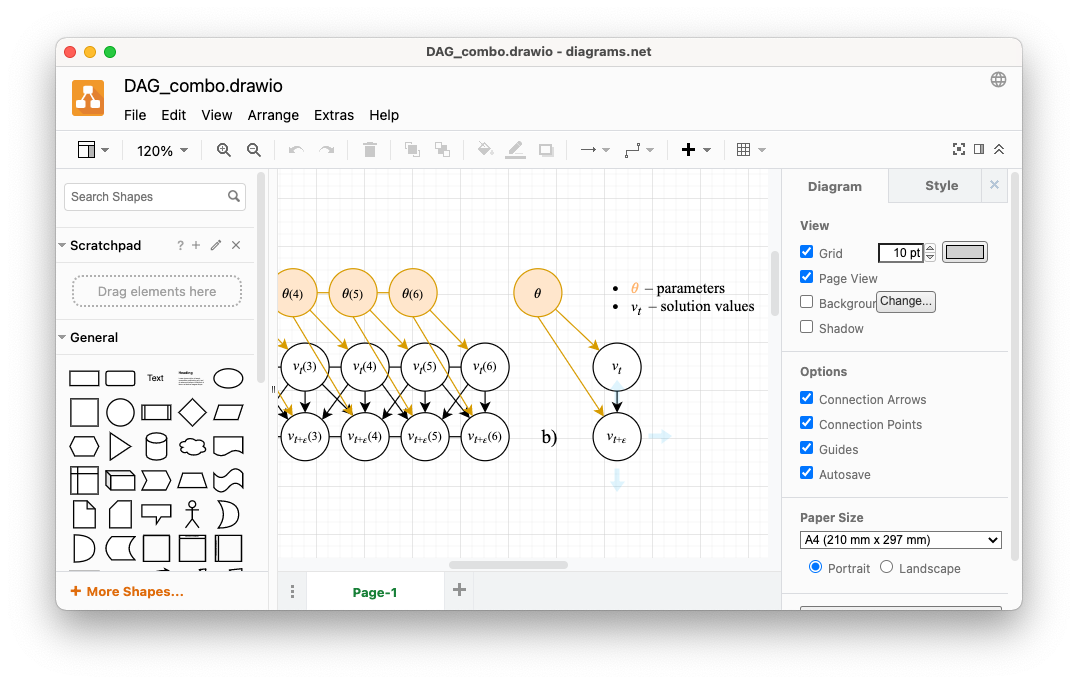
diagrams.net (formerly draw.io) is a browser-based diagram editor. It is free and open source. It has all the modern convenience of the new generation of browser-based apps and the recent versions are pretty good; good enough that this is my go-to tool. I can use it as a desktop app or integrated browser widget:
- live online
- desktop version
- integrated into the extended jupyter cinematic universe
- integrated into VS Code
This provides support also for the flowchart-style graphical model diagrams that I need a lot, and many other process-model diagrams, plus a little bit of generic diagramming. It can import Gliffy files.
2 Inkscape
Open source Inkscape can do everything; it is essentially targeting the Adobe Illustrator audience. Aimed firstly at general vector graphic design, which means the functions I want for sciencey stuff are not front-and-center, but it can be done.
Inkscape supports LaTeX math rendering in its PDF+LaTeX mode, which is extremely useful.
3 ipe
ipe has, if not a actually intuitive interface, at least one that makes certain specialist science graphing tasks easy. It’s mostly simple to learn, modulo some oddities - e.g. you change the page size by creating and importing an XML stylesheet. Riiiight.
Also, it can’t export SVG, merely PDF and EPS, each of which are not so much vector graphics standards, as the battleground beneath the standards behind which the corporate armies clash. Nonetheless, it repays persistence and can get some surprising qualitative diagrams done.
Ipe’s main features are:
- Entry of text as LaTeX source code. This makes it easy to enter mathematical expressions, and to reuse the LaTeX-macros of the main document. …
- Produces pure Postscript/PDF, including the text…
- It is easy to align objects with respect to each other (for instance, to place a point on the intersection of two lines, or to draw a circle through three given points) using various snapping modes…
That last point sounds minor, but it is an ingenious move that makes all the more questionable design choices worthwhile. Anyone who has every spent 90 minutes on doing trigonometry to get a pstricks diagram right, and wondered what happened to the thing where computers eliminated drudge work, will weep upon the sight of it.
These days, diagrams.net has acquired many of the same alignment features and the point of differentiation is shrinking.
Has built-in Lua scripting, like everything on the planet. Integrates with matplotlib.
Recommended: handy user contributions by Stefan Huber.
See pdf2svg to export the PDFs to other formats.
4 ASCII art
5 Figma
figma the browser-based graphic design tool might also be functional for diagrams. Its special selling point is that it is easy to collaboratively edit live. It is not particularly targeted at science but also it has lots of science-useful functionality. Not free, but many organisations have a corporate subscription.
6 Gliffy
Gliffy is an “enterprise” diagram tool whose selling point seems to be that it is integrated into lots of other enterprise things and works from the browser. AFAICT it is OK but it is hard to label things with mathematics, and the alignment is not quite as nice as diagrams.net. Not free, but many organisations have a corporate subscription.
7 Pencil
pencil is a fashionable tool for GUI design that happens to be good for some other tricky things, notably flow charts. It’s built as a browser app so has good compatibility with export and presumably some hackability. I have not looked at this one for a while; I wonder if it is still current.
8 Dia
Dia has some neat features; and many confusing ones I can’t imagine the use-case for. Possibly this last one is because I am not in middle management. If you need to produce specialised diagram types for your project manager, Dia probably has the function.
Dia supports more than 30 different diagram types like flowcharts, network diagrams, database models. More than a thousand readymade objects help to draw professional diagrams. Dia can read and write a number of different raster and vector image formats. […] Dia can be scripted and extended using Python.
Crashes on my recent macOS, though, and I can’t be arsed working out why.
9 Boxy
An Inkscape alternative option leveraging web technology is Jarosław Foksa’s Boxy. Not sure if it has advantages over diagrams.net.
10 xfig
xfig combines the imprecision of drawing through GUIs, with the abstruseness and fragility of drawing through code. Listed here for the surpassing beauty of its manual page.
11 Probabilistic graphical models
Footnotes
Notice there are few commercial entrants in this race? I’m too poor for any Autodesk product, and unconvinced of their utility unless I wish to build some kind of major concrete structure. I did buy Omnigraffle, the much-touted diagram editor for macOS. What a disaster; expensive, unintuitive, over-engineered. Like they ripped off
xfig, took out the API and compensated for it by putting bezels on the icons. If you want to waste hours with horribly inscrutable drafting products, there are many open-source options available that can give you that experience for free.↩︎