VS Code for python
An acceptable python IDE for very low cost
August 10, 2021 — January 26, 2024
VS Code support for python is getting pretty good. Here is where I document how, and my preferred configuration.

1 Interaction with/execution of python
1.1 Interactive python
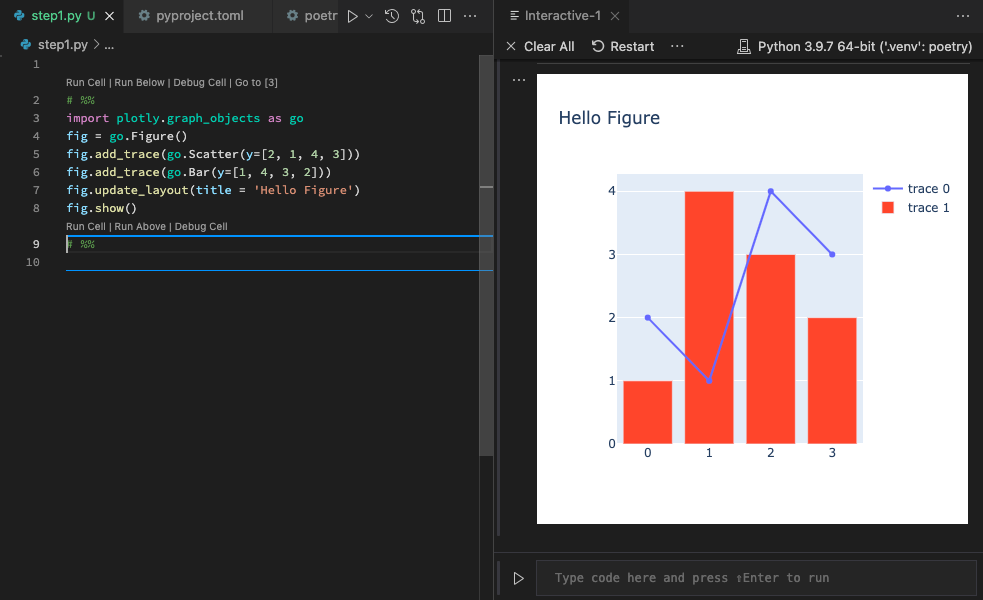
TIL that VS code’s so-called jupyter support includes a fully interactive python code environment that does not require the awful jupyter notebook file-format/interface, but operates plain python modules.
The trick is to put the magic # %% comment in:
Now everything after that comment is one “cell” that I can run with a click or . NB: that keyboard shortcut to execute the cell was not reliable for me work. I updated it to Shift-Enter to avoid a possible conflict.Ctrl-Enter
Plotting is supported too (opens in a side window).
This is a helpful idea. For one thing, it avoids the horrible, bad, no good jupyter file format.
| Command | Keyboard shortcut |
|---|---|
| Python: Go to Next Cell | Ctrl+Alt+] |
| Python: Go to Previous Cell | Ctrl+Alt+[ |
| Python: Extend Selection by Cell Above | Ctrl+Shift+Alt+[ |
| Python: Extend Selection by Cell Below | Ctrl+Shift+Alt+] |
| Python: Move Selected Cells Up | Ctrl+; U |
| Python: Move Selected Cells Down | Ctrl+; D |
| Python: Insert Cell Above | Ctrl+; A |
| Python: Insert Cell Below | Ctrl+; B |
| Python: Insert Cell Below Position | Ctrl+; S |
| Python: Delete Selected Cells | Ctrl+; X |
| Python: Change Cell to Code | Ctrl+; C |
| Python: Change Cell to Markdown | Ctrl+; M |
Various things are broken. For example, sometimes the restart button doesn’t work to restart a given kernel, so I need to run some more code and abort it and then restart it. The keyboard shortcuts to execute given cells sometimes don’t work. IDK how things be.
1.2 Jupyter
Jupyter notebook support is highly evolved, in that we can run, edit and execute Jupyter notebooks inside VS Code. If it is not seamless then at least the seams are not too prominent.
I am a jupyter skeptic but I admit VS Code does sift some of the some of the rougher chunks out of the jupyter grind. All in all, editing jupyter notebooks in VS Code is much better than the jupyter notebook browser front end, at least for my workflow, and less jupyter is better jupyter.
Further, heaps of other things that native jupyter notebooks cannot even dream of just magically work in VS Code. Type inference? Yes! Autocomplete? Sure! Debugger injection? Sometimes! Search and replace across a whole project? Urgh, kinda! Style checking? Yes! Refactor assistance? Yes, and it only fails some random subset of times! Comprehensible documentation for all of these features with a single source of truth? Usually!
There are still some broken things (refactoring ignores jupyter notebooks sometimes, session sharing broke for me in a weird way last time, search is unpredictable, keyboard shortcuts are inconsistent, scrolling to the correct bit of the notebook just fails sometimes) but since jupyter notebooks are IMO irreducibly just a bit shit, I will take whatever incremental and patchy improvement I can get.
I imagine that jupyter notebook extensions don’t work for VS Code but I have not tested this. Essentially all the jupyter extensions I was installing were to make the jupyter notebook interface impersonate VS Code, so I can pay this no mind.
Points of friction: Jupyter Notebook can interact badly with VS code remote, losing data if there is a buggy extension installed. (See also.)
2 Debugger
VS Code supports a multi-language debugger based on an open debugger protocol which includes support for the python-style debugging. The details are managed by an extension* microsoft/vscode-python-debugger, but users can remain oblivious to that unless doing some ornate remote debugging (for which, see below).
Install at Python Debugger Extension
Notable features include visualisation of various python objects, including Pytorch tensors.
2.1 Interactive/jupyter kernel debugger
It was not obvious how to use this debugger tool for post-mortem debugging in jupyter notebooks, or python interactive sessions, i.e. how to see what led to a crash after the fact, which is a lamented, powerful feature of the basic python debugger unavailable to us in fancy modern jupyter.
The manual was silent on the matter; Last time I searched online for “python post mortem debugger jupyter vscode” I was directed to this very page. So I guess the answer needs to go right here:
I needed to activate the Debugger menu in the sidebar and then check the User uncaught exception option. We cannot actually get this in post mortem mode; we need to notify python in advance by launching the cell using the Debug Cell command. Then, when the cell crashes, we get a debugger window.
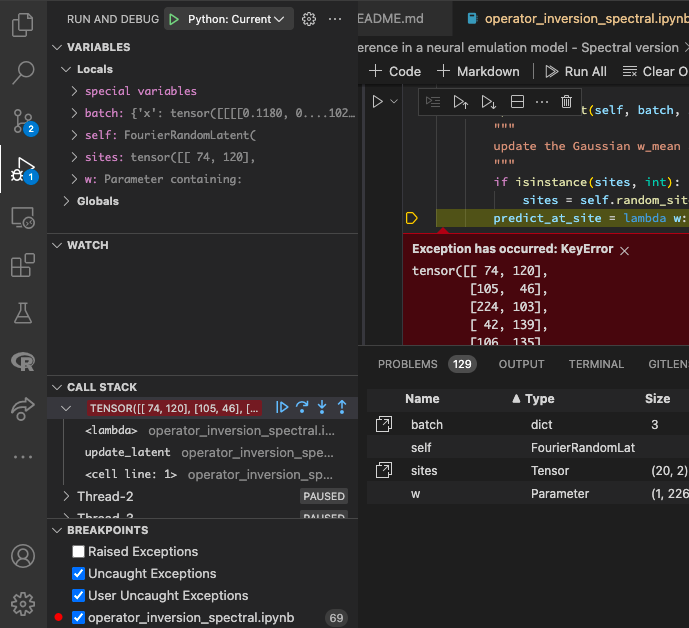
Then those tiny buttons next to the Main thread act as step debugger commands.
AFAICT the jupyter/interactive python debugger is orthogonal, configuration-wise, to the normal python debuggers; it does not seem to need a debugger configuration, nor to care about the contets of launch.json. Or am I trippin’?
There are various annoying things about the debugger in interactive mode. I cannot seem to turn off the “feature” wherein it stops at the first line of the cell and asks permission to continue. I have never ever needed to start debugging at line 1; for me a debugger is something I use to understand what is happening deep inside the code.
Annoyingly, the debugger cannot go “up” the call stack into the parent function of a given invocation; any attempt to traverse the call stack gets us stick in some
So it’s… ok. It is fine. There is a lot of repetitively clicking on things, and not quite as much flexibility as I would like, but it it is less horrible than jupyter notebooks, so I will take it.
2.2 Useful configs
A launch.json supporting local and remote debugging is this:
{
    "version": "0.2.0",
    "configurations": [
        {
            "name": "Python: Remote Attach",
            "type": "python",
            "request": "attach",
            "justMyCode": true,    // don't debug libraries
            "stopOnEntry": false,  // don't wait around for me to click "continue"
            "connect": {
                "host": "localhost",
                "port": 25698
            },
            "pathMappings": [
                {
                    "localRoot": "${workspaceFolder}",
                    "remoteRoot": "."
                }
            ]
        },
        {
            "name": "Python: Current File",
            "type": "python",
            "request": "launch",
            "program": "${file}",
            "console": "integratedTerminal",
            "justMyCode": true,    // don't debug libraries
            "stopOnEntry": false   // don't wait around for me to click "continue"
        }
    ]
}
VS code will not automatically construct the tunnel, so we still need do that manually. We can do this the classic way,
There is a semi-automatic tunnelling tab next to the terminal window in VS code that probably does something similar. Full walk-through here. Hard-coding the values in a launch.json might seem clunky. It is. Here are some people discussing that bulletmark/debugpy-run is a workaround providing some types of dynamic configurations.
NB: there are still some references around to ptvsd, an older version of the python plugin which is now deprecated. Ignore ’em.
Pro-tip: code which uses threading for parallelism can hang in the usual weird ways when debugged. Some of these can be ameliorated by invoking with
3 Refactoring
Somewhat magical, sometimes. But I cannot work out why it only does magical reactoring assistance sometimes. TBD.
4 “Intellisense”
pylance (source) is an extension that works alongside Python in Visual Studio Code to provide performant language support. Under the hood, Pylance is powered by Pyright, Microsoft’s static type checking tool. Using Pyright, Pylance has the ability to supercharge your Python IntelliSense experience with rich type information, helping you write better code faster.
There are other language servers but I have found it advisable to use pylance, otherwise things crash.
5 Linting
There are many linters supported in VS code..
pylint is my preferred linter for now. flake8 is very shrill and clogs the logs with warnings about cosmetic problems market as critical errors.
They are both slow. I might try ruff.
5.1 linting with numpy, torch etc
Symptom: we get errors like Pylint E1101 Module 'torch' has no 'from_numpy' member. We can fix it using pylint “generated members”. Add this to settings.json: